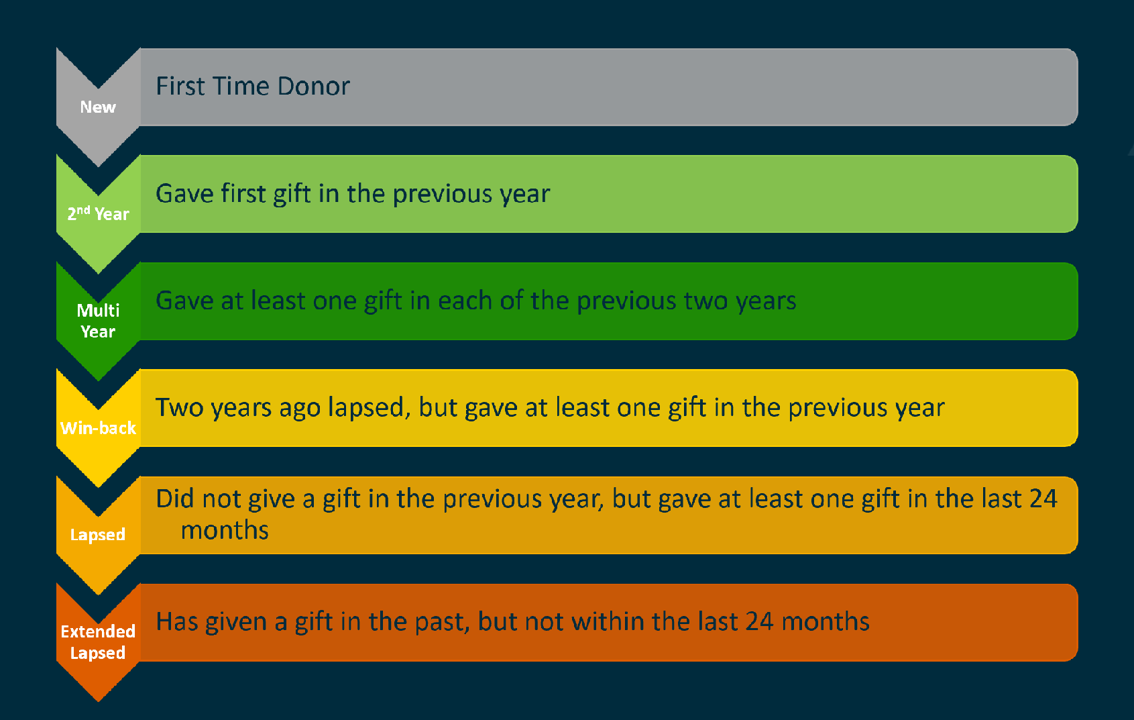
The donor database file audit that Analytical Ones prepares for its clients is called the Strategic Growth Analysis (SGA). One of the keys to the SGA is that we look at many metrics by donor lifecycle.

We do this because file composition – or the proportion of donors in each lifecycle – is different for each organization. The risk if a file isn’t analyzed this way is sometimes overall metrics can be misleading.
Let’s take overall donor retention. If you Google “donor retention” you will find that there are over 34 million hits. So obviously, this is an important topic. Whenever overall retention falls, there is often panic within the organization – but before you panic, check these two graphs out.
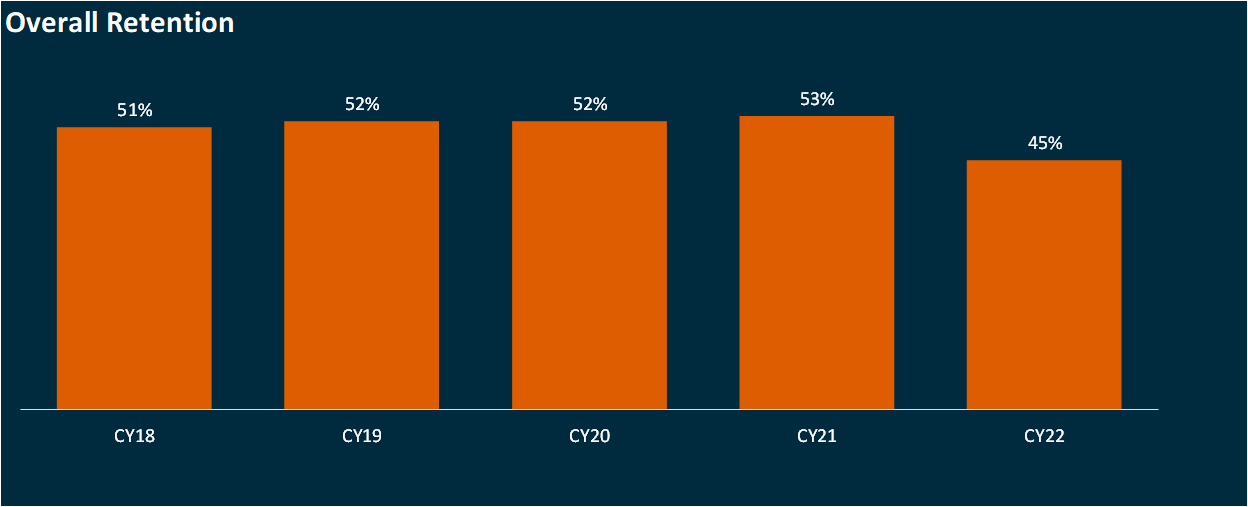
In the first graph, we have a 5-year trend in overall retention.

Post-pandemic, this was not an unusual overall retention graph. After fairly steady overall retention, many organizations experienced a drop in retention in CY22.
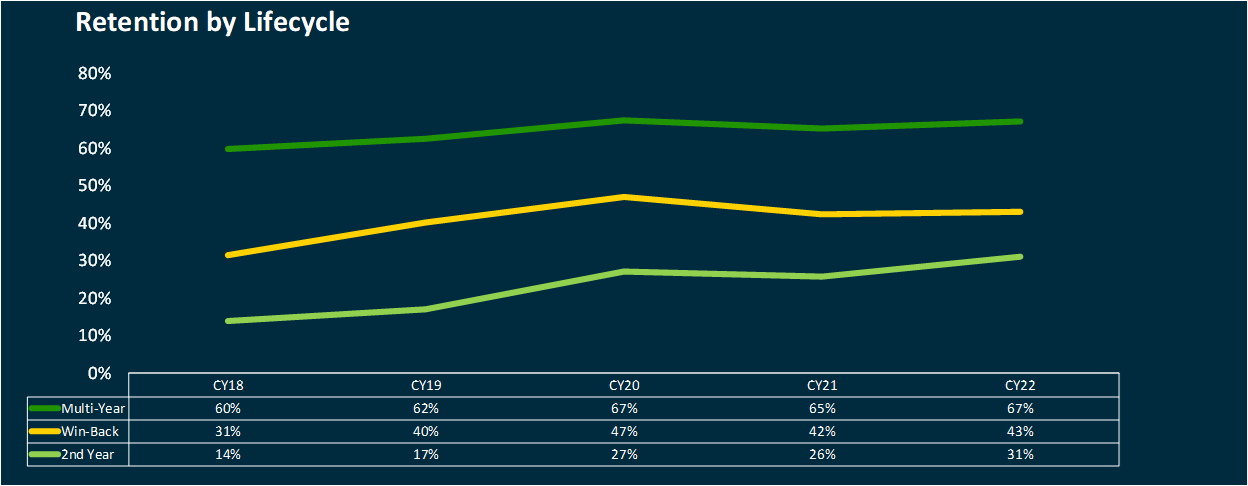
But when we take a deeper look at retention by donor lifecycle, we actually see that retention incrementally increased in every lifecycle.

How could overall retention decrease yet each donor lifecycle increase?
This occurrence is not uncommon. The answer is because of a change in the organization’s file composition. In this example, the organization acquired a lot of new donors in CY21. In CY22, those donors were classified as “2nd Year” donors for retention. As you know, 2nd Year donors don’t retain as well. Overall retention treats each donor the same, so when you have a big influx of new donors, your overall retention rate the next year is likely to fall. This is not necessarily because of anything wrong with the fundraising program, but because of the greater proportion of new donors on file.
So, the next time you see overall retention rates fall, don’t panic. Take the time and look deeper into the data. Falling overall retention rates may not have anything to do with poor retention strategies.

